The console object is a very useful feature of browsers that have been around for many years. It provides access to the browser’s debugging console.
Most web developers know how to print messages to the console using console.log. But I’ve found that many don’t know about other features of the console, even though they can be very useful for every web developer.
In this post, I’ll go over some of these lesser-known features and capabilities. I hope that you will find them useful and interesting, and will incorporate them into your day-to-day workflow and code.
I added a screenshot of the result of each example. If you want to try things for yourself, just open the DevTools and copy-paste the examples.
Using multiple arguments
It is quite common to log several values together. These may be a message along with a related value or the content of several related variables.
Here are two ways I’ve seen developers achieve this:
1. String concatenation
const a  123;
const b  'abc';
const c  {aa: 234, bb: 345};
console.log('Foo bar ' + a + ' ' + b + ' ' + c);
Result of string concatenation
2. Using multiple calls
const a 123;
const b 'abc';
const c {aa: 234, bb: 345};
console.log('Foo bar');
console.log(a);
console.log(b);
console.log(c);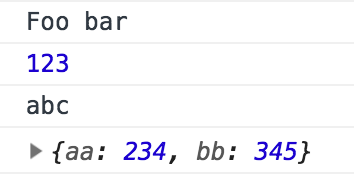 Result of multiple calls
These methods may work (sort of), but:
- They are not flexible
- They are not very readable
- They are cumbersome to write
- They need special means to work properly with object variables
There are several better alternatives for outputting many variables. The most useful one for quick data dump is sending multiple arguments to console.log like so:
const a 123;
const b 'abc';
const c {aa: 234, bb: 345};
console.log('Foo bar', a, b, c);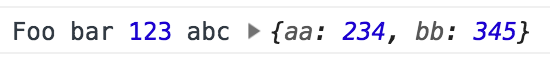 Result of multiple arguments
This is very handy for debugging, but the output is not very controllable. For output that is intended to be read (like for a library), I would use a different method, which we’ll get to later on.
Using different log levels
Besides the familiar console.log, there are other logging methods that correspond to different log levels:
console.debug('Debug message');
console.info('Info message');
console.log('Good old log message');
console.warn('A warning message');
console.error('This is an error');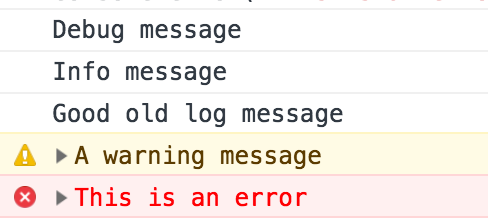 Log levels as seen in Google Chrome
Each log level may have a different default style, which makes spotting errors and warnings at a glance easier.
You can usually also filter which log levels you want to be visible in the DevTools console. This may help reduce clutter.
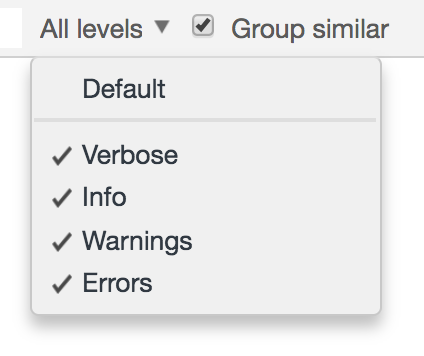 Filtering log levels in Google Chrome
The appearance of the different levels and the filtering granularity changes from browser to browser.
Grouping console lines
Sometimes it is useful to group log messages together. It may allow for more organized and readable output.
This is actually very simple to achieve:
console.group();
console.log('First message');
console.log('Second message');
console.groupEnd();
Grouped log messages
Note that log groups can also be nested and labeled:
console.group('Group aaa');
console.log('First message');
console.group('Group bbb');
console.log('level 2 message a');
console.log('Level 2 message b');
console.groupEnd();
console.log('Second message');
console.groupEnd();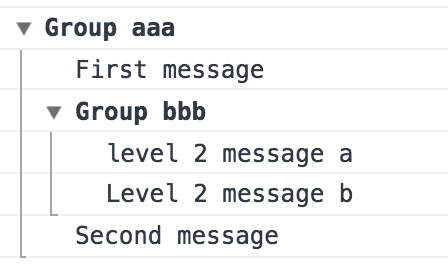 Nested and labeled groups
In case you want the group to appear collapsed, use console.groupCollapsed()
Measuring performance
Measuring the time between points in the code can serve as a quick way to check the performance of some operations.
Here is a trivial way to do this:
const start  Date.now();
// do some stuff
console.log('Took ' + (Date.now() - start) + ' millis');
This works, but there’s a more elegant way to achieve something similar:
console.time('Label 1');
// do some stuff
console.timeEnd('Label 1');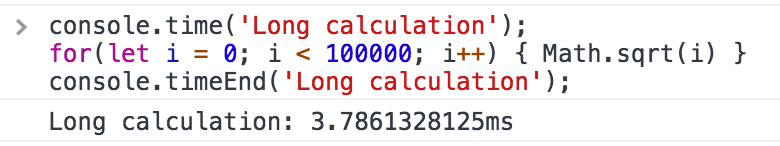 Measuring time with the console
The code is shorter, the measurement is more accurate, and you can keep track of up to 10,000 different timers in parallel on a page.
String substitution
Previously we learned that you can pass multiple arguments to console.log to output multiple values simultaneously. Another way to achieve something similar is to use string substitution. This method requires familiarity with the available placeholders but offers greater control over the output.
const a  123;
const b  'abc';
const c  {aa: 234, bb: 345};
console.log('number %d string %s object %o', a, b, c);
Logging with string substitution
Take a look at the documentation (link at the end) for a list of available placeholders.
Styling
It can be nice to style different log messages differently to increase readability.
We already mentioned that browsers give different default styling to some log levels, but this can also be customized according to your specific needs. Styling is done using a subset of CSS rules, passed in a string as the second parameter, and applied using the marker %c.
Note that you can have different styles for different parts of the log message.
For example:
console.log("Normal %cStyled %clorem %cipsum", "color: blue; font-weight: bold", "color: red", "background-image: linear-gradient(red, blue); color: white; padding: 5px;");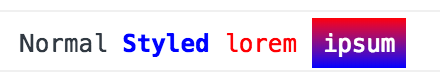 Styled log messages
Summary
In this post, we have seen some of the features of the console that I think are less well-known and more useful. This is by no means an exhaustive list of everything the console can do, as it has many more tricks up its sleeve.
If this got you interested and you want to find out what other things you can do with the console, I recommend reading the relevant documentation on MDN and trying things out in DevTools.